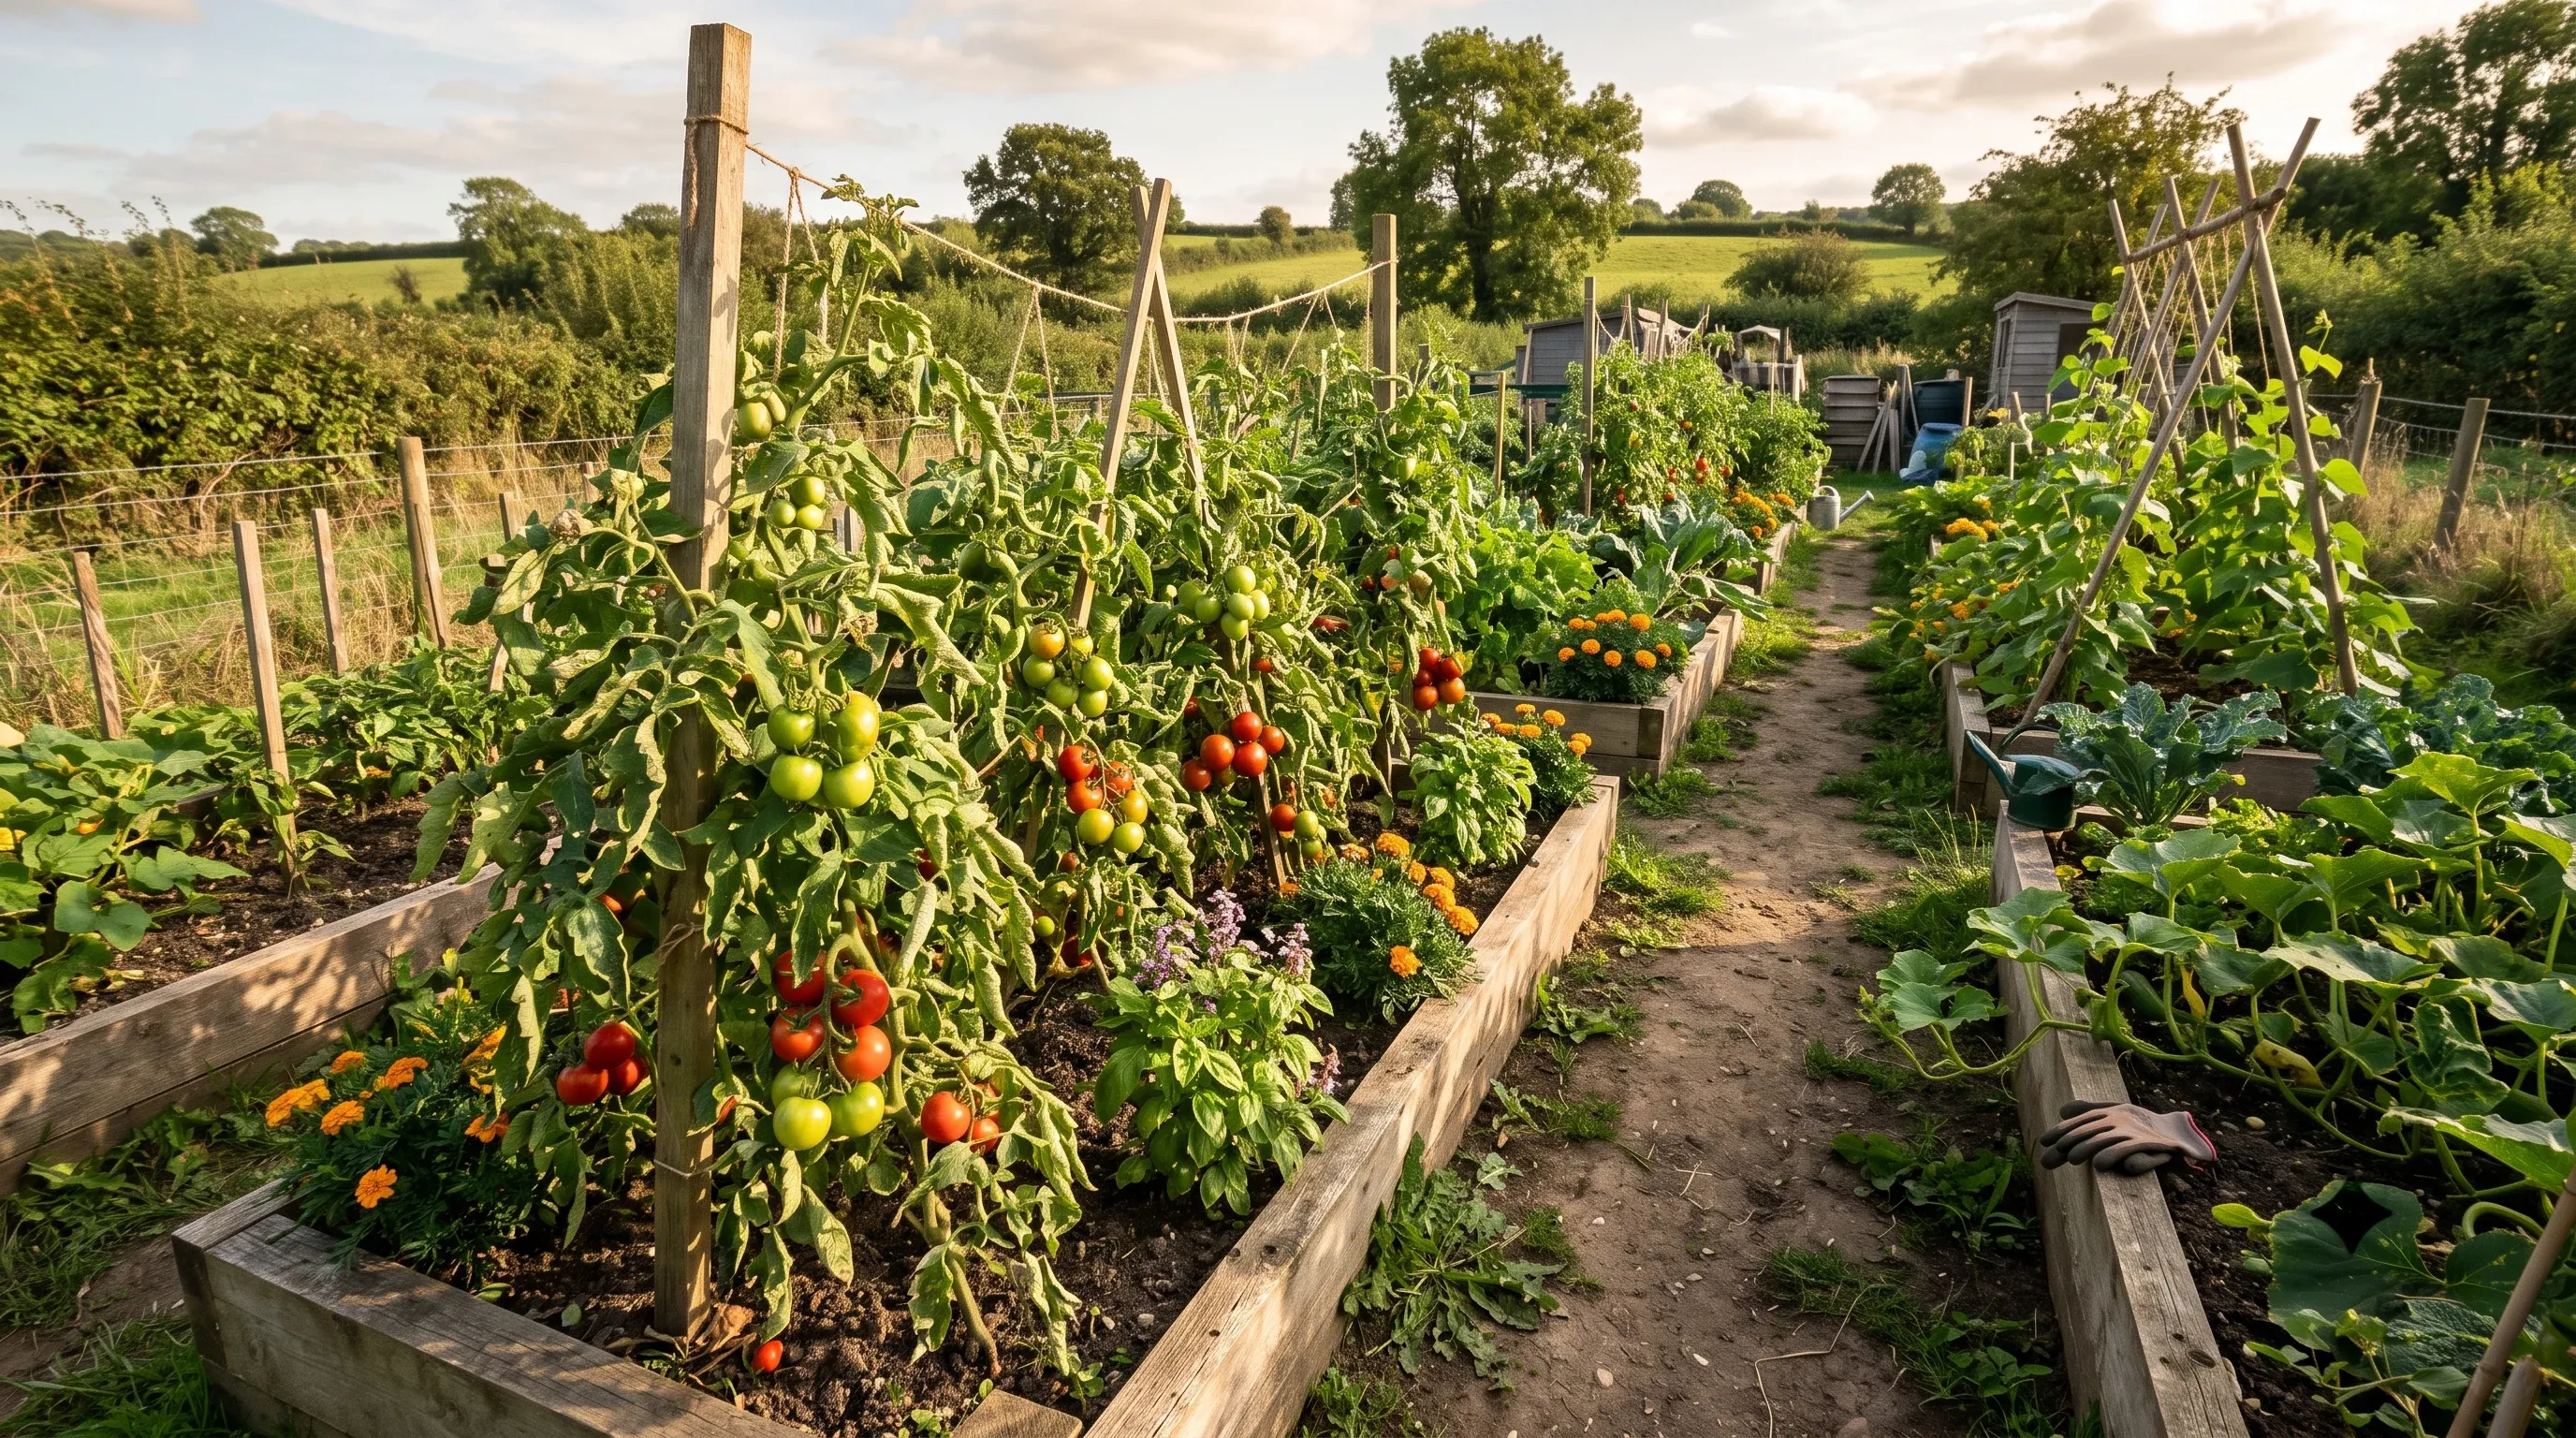
Growing degree days (GDDs) accumulate daily warmth above a crop’s base temperature (Tbase). Below Tbase, no heat units are credited. Cool-season vegetables have a Tbase near 4°C (39°F); warm-season crops like tomatoes and peppers sit at 10°C (50°F) or above. The table below lists peer-reviewed Tbase and Tupper values for 22 vegetables from Paredes et al. (2025), with seven additional crops estimated by botanical family proxy.
If you have ever wondered why the same tomato variety ripens in July in southern France but not until September in northern England, growing degree days are most of the explanation. Both sites get similar day lengths in high summer, but the accumulated warmth above the crop’s base temperature is very different. GDD models turn that temperature difference into a usable maturity prediction.
Most GDD resources online either focus on field cereals, where the models originated, or give a single Tbase value without acknowledging that the literature contains ranges. This article compiles Tbase and upper threshold (Tupper) values for 22 vegetable crops from the most comprehensive recent peer-reviewed synthesis available: Paredes et al. (2025), which reviewed over 117 crops across hundreds of published studies. Three crops also have OSU Extension field-validated values from Pacific Northwest trials (Andrews et al. 2021). Seven crops absent from the primary source are included with family-proxy estimates, clearly labelled throughout.
One honest note before the table: Leaftide’s harvest prediction engine uses Tbase values calibrated against observed harvest data from real gardens, and these sometimes differ from the literature ranges shown here. A value that minimises prediction error in a cool maritime climate is not necessarily the same as the physiological minimum measured in a growth chamber. Both kinds of number are useful: the table answers what the peer-reviewed literature says; the harvest date calculator shows how Leaftide applies these values to your specific location.
GDD Base Temperature Reference Table
The table covers 22 crops with primary source data plus seven with family-proxy estimates. Crops are grouped into warm-season, cool-season, and legumes. Tbase and Tupper are shown in both Celsius and Fahrenheit. Where the literature reports a range across multiple independent studies, the range is shown rather than a single value.
How to read this table
Tbase is the lower threshold: no GDD accumulation below this temperature. Tupper is the upper threshold: no additional accumulation above it. A crop’s daily GDD contribution is: ((min(Tmax, Tupper) + min(Tmin, Tupper)) / 2) minus Tbase, floored at zero.
Warm-season crops
| Vegetable | Tbase °C | Tbase °F | Tupper °C | Tupper °F | Source | Notes |
|---|---|---|---|---|---|---|
| Tomato | 7–10 | 45–50 | 28–33 | 82–91 | Paredes 2025, Table 3 | Three independent studies; Solanaceae |
| Pepper (bell and chili) | 10 | 50 | 34–35 | 93–95 | Paredes 2025, Table 3 | Consistent across two studies |
| Courgette / zucchini | 8–10 | 46–50 | 32–38 | 90–100 | Paredes 2025, Table 3 | Cucurbita pepo |
| Cucumber | 10 | 50 | 35 | 95 | Paredes 2025 / OSU | Field-validated † |
| Pumpkin / squash | 7.2–10 | 45–50 | 32–38 | 90–100 | Paredes 2025, Table 3 | Cucurbita pepo |
| Aubergine / eggplant | 10–11 | 50–52 | 35 | 95 | Paredes 2025, Table 3 | Solanaceae |
| Sweetcorn | 8–10 | 46–50 | 28–41 | 82–106 | Paredes 2025 / OSU | Field-validated †; wide Tupper range across studies |
| Basil | ~11 | ~52 | 35 | 95 | Paredes 2025, Table 4 | Warm-season herb; chilling injury below 10°C |
Cool-season crops
| Vegetable | Tbase °C | Tbase °F | Tupper °C | Tupper °F | Source | Notes |
|---|---|---|---|---|---|---|
| Carrot | 4–6 | 39–43 | 28–30 | 82–86 | Paredes 2025, Table 1 | Range spans three studies |
| Beetroot / table beet | 4–4.4 | 39–40 | 24–35 | 75–95 | Paredes 2025, Table 1 | Wide Tupper range across studies |
| Broccoli | 4.4–5 | 40–41 | 24–30 | 75–86 | Paredes 2025, Table 2 | Cole crop (Brassica) |
| Cauliflower | 4–4.4 | 39–40 | 30 | 86 | Paredes 2025, Table 2 | Cole crop (Brassica) |
| Cabbage | 4–4.4 | 39–40 | 24–30 | 75–86 | Paredes 2025, Table 2 | Cole crop (Brassica) |
| Lettuce | 3.5–4.5 | 38–40 | 28 | 82 | Paredes 2025, Table 2 | Four studies across varieties |
| Spinach | 4–4.4 | 39–40 | 24–25 | 75–77 | Paredes 2025, Table 2 | Low Tupper reflects heat sensitivity |
| Celery | 1–4 | 34–39 | 24 | 75 | Paredes 2025, Table 1 | Wide Tbase range across studies |
| Onion | 1.8–5 | 35–41 | 29.5–45 | 85–113 | Paredes 2025, Table 1 | Wide ranges; Tupper varies greatly |
| Radish | 4–4.4 | 39–40 | 30–35 | 86–95 | Paredes 2025, Table 1 | |
| Parsley | 4 | 39 | 27 | 81 | Paredes 2025, Table 4 | Single study; low Tupper |
| Kale | — | — | — | — | — | Not in primary source; proxy: cabbage (~4–4.4°C / 39–40°F) |
| Celeriac | — | — | — | — | — | Not in primary source; proxy: celery (1–4°C / 34–39°F); same species |
| Leek | — | — | — | — | — | Not in primary source; proxy: onion (~1.8–5°C / 35–41°F); same genus |
| Parsnip | — | — | — | — | — | Not in primary source; proxy: carrot (4–6°C / 39–43°F); Apiaceae |
| Fennel | — | — | — | — | — | Not in primary source; proxy: carrot (4–6°C / 39–43°F); Apiaceae |
| Chard | — | — | — | — | — | Not in primary source; proxy: beetroot (4–4.4°C / 39–40°F); same species |
Legumes
| Vegetable | Tbase °C | Tbase °F | Tupper °C | Tupper °F | Source | Notes |
|---|---|---|---|---|---|---|
| Pea | 4.5–5 | 40–41 | 27 | 81 | Paredes 2025, Table 5 | Four independent studies |
| French bean / snap bean | 9–10 | 48–50 | 30–35 | 86–95 | Paredes 2025 / OSU | Field-validated †; see methodology note |
| Broad bean / fava bean | 3.6–5.5 | 38–42 | 30 | 86 | Paredes 2025, Table 5 | Vicia faba; centre ~4.4°C |
| Runner bean | — | — | — | — | — | Not in primary source; proxy: French bean (9–10°C / 48–50°F); Phaseolus coccineus |
† Field-validated by OSU Extension EM 9305 (Andrews et al. 2021), Pacific Northwest field trials, single-sine calculation method. — Not covered by primary source. Proxy estimate based on closest botanical relative; treat as indicative, not calibrated.
Why sources disagree on base temperatures
The French bean is the clearest example of genuine methodology-driven disagreement. OSU Extension field trials (Andrews et al. 2021) use a Tbase of 4.4°C (40°F) for snap beans grown in western Oregon. Paredes et al. (2025), synthesising European and South American field studies, reports 9–10°C (48–50°F). Both are peer-reviewed, both use real field data. The numbers are not errors. They reflect different things.
There are three main reasons GDD base temperatures differ between sources:
Physiological vs mathematical base. A physiological Tbase is the temperature below which a specific biochemical process (cell division, enzyme activity) actually stops. This is measured in controlled growth chambers. A mathematical Tbase is the value that, when plugged into a regression model against field data, minimises prediction error for that dataset. These two numbers are related but rarely identical. A mathematical Tbase is optimised for its specific climate and crop variety; it is not a universal biological constant.
Life stage being modelled. Germination, vegetative growth, flowering, and fruit development have different thermal responses within the same crop. A Tbase derived from germination trials will be lower than one derived from fruit maturity timing. The Paredes 2025 compilation covers full crop cycles, but some source papers within it focus on specific phases. The OSU models are explicitly calibrated to harvest timing in transplanted or direct-seeded field conditions.
Regional calibration. A model fitted to field data in Andalucía or the Willamette Valley may not transfer directly to the English Midlands or the Rhine valley. Temperature variability, radiation levels, and common variety selection all interact with GDD accumulation in ways that shift the effective Tbase. When growers in cool maritime climates report that a published GDD model predicts harvests too late, the cause is often a Tbase that was calibrated in a warmer, sunnier environment.
For practical use, this means there is no single correct Tbase for most vegetables. The table above shows the range that the peer-reviewed literature supports. If you are building your own model, the best Tbase is the one that, combined with local temperature data, predicts harvest dates accurately in your specific garden.
How Leaftide uses this data
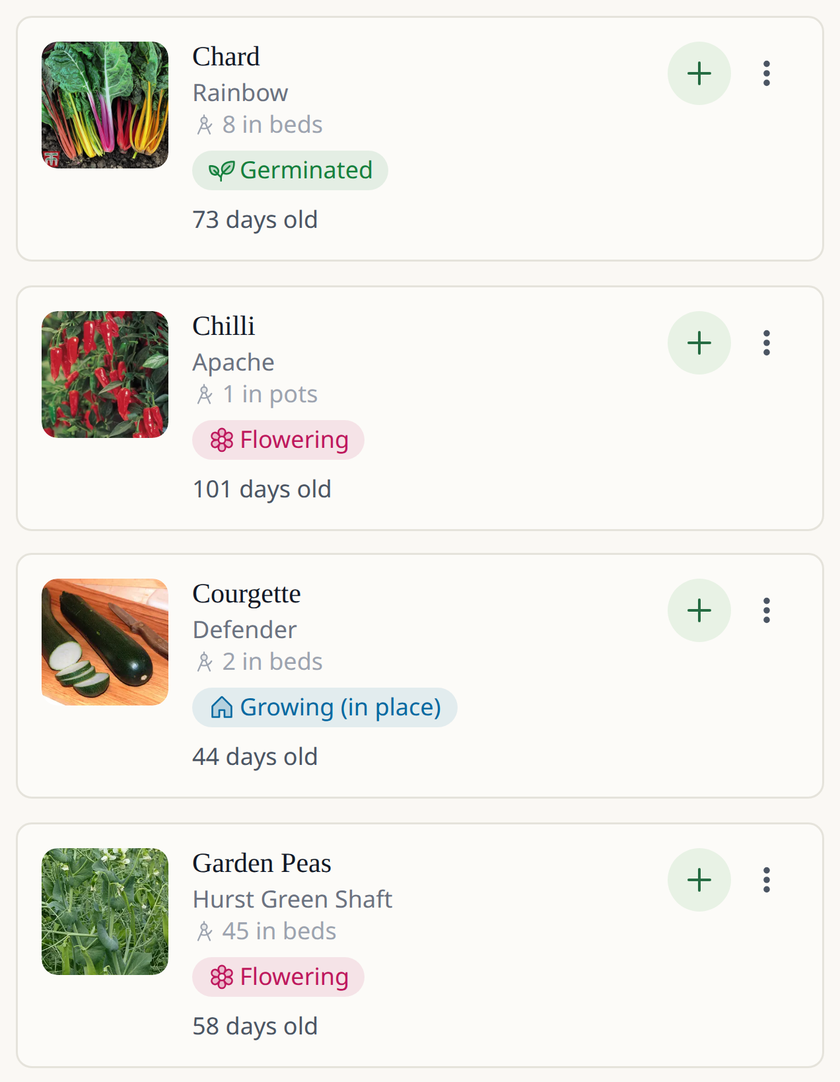
Leaftide’s harvest prediction engine uses GDD accumulation as one of its core signals. The Tbase values in the app come from the plant database and in some cases differ from the literature ranges shown above. For example, tomato uses 10°C in the app, which sits at the top of the published range of 7-10°C. Pepper uses 12°C, which is above the Paredes 2025 value of 10°C.
These differences are not errors. Different Tbase values produce different accumulated GDD totals and different harvest predictions. The literature table represents the best-available published consensus; the app values reflect the database entries compiled when those plants were added, and will be reviewed over time as more evidence accumulates.
This transparency matters because a reader comparing numbers between this article and the app’s predictions will notice differences. The literature table is the scientific reference; the app is a planning tool optimised for practical use.
You can see GDD accumulation and harvest predictions for your specific crops and location using the harvest date calculator.
See GDD accumulation for your garden.
Leaftide calculates growing degree days from your local climate data and shows harvest windows for every crop you are tracking. Try the harvest date calculator for your location.


Methodology note
The primary source for all values in the table is:
Paredes, P., Pereira, L.S., Paredes, R.S., Rodrigues, G.C. and Ramos, T.B. (2025). Estimating the lengths of crop growth stages to define the crop coefficient curves using growing degree days (GDD): Application of the revised FAO56 guidelines. Agricultural Water Management 319, 109755. DOI: 10.1016/j.agwat.2025.109755
This paper reviewed published GDD studies across 117 crops and compiled consolidated Tbase and Tupper values. For vegetable crops, the primary tables are Tables 1–5. Where multiple studies within the paper reported different values, the full range is shown in the table above rather than a single consolidated point.
The secondary source for three field-validated crops (cucumber, sweetcorn, French bean) is:
Andrews, N., Brewer, L., Groff, A. and Arnold, B. (2021). Vegetable Degree-day Models: An Introduction for Farmers and Gardeners. OSU Extension Publication EM 9305. Oregon State University Extension Service. Available at: extension.oregonstate.edu
The OSU publication is based on multi-season field trials in the Pacific Northwest using the single-sine calculation method. The Tbase values it reports reflect optimised prediction accuracy for commercial field production in that region.
Seven crops (kale, celeriac, leek, parsnip, fennel, chard, runner bean) are not covered by either primary source. Proxy values are derived from the closest botanical relative with a confirmed primary-source Tbase. These are labelled with a dash and a family proxy note in the table. They should not be cited as primary data.
Sources
- Paredes et al. (2025) — Estimating the lengths of crop growth stages to define the crop coefficient curves using growing degree days (GDD). Agricultural Water Management 319, 109755. doi.org/10.1016/j.agwat.2025.109755 — Primary source for all Tbase and Tupper values in the table.
- Andrews et al. (2021) — Vegetable Degree-day Models: An Introduction for Farmers and Gardeners. OSU Extension EM 9305. extension.oregonstate.edu/catalog/pub/em9305 — Field-validated values for cucumber, snap bean, and sweetcorn.
- Elnesr et al. (2013) — cited within Paredes 2025 as a secondary aggregation source for multiple crops.
- Maynard, D.N. and Hochmuth, G.J. (2007). Knott’s Handbook for Vegetable Growers, 5th edition. Wiley — cited within Paredes 2025 for several cool-season crops.
- Fresco, L.O. et al. (2021) — cited within Paredes 2025; grower-sourced data for carrots, beetroot, and cauliflower.
Cite this data
Leaftide’s compilation of GDD base temperatures in this article is published under CC BY 4.0. You are free to share and adapt the table with attribution.
To cite Leaftide’s compilation:
Leaftide (2026). Growing degree day base temperatures for vegetables. Retrieved from https://leaftide.com/learn/growing-degree-days-base-temperatures/
The underlying Tbase and Tupper values are attributed to Paredes et al. (2025) and Andrews et al. (2021) as primary sources and are not relicensed by Leaftide. To cite those values in academic or commercial work, cite the original papers directly.